Managing swim lanes#
Use swim lanes to display a user-centered view of your value stream data.
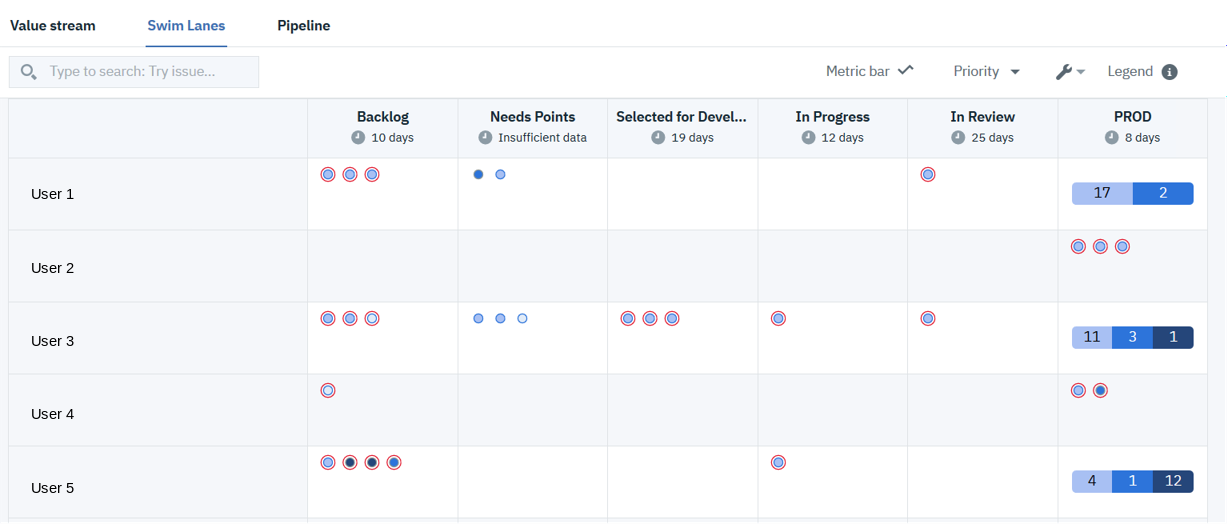
Instead of the project-centered view, you can use the swim lane feature to display a user-based view of your value stream data. A swim lane organizes the value stream into a table. The table columns represent value stream stages, and the rows represent users, as shown in the following illustration:

The project particles displayed on the Swim Lanes tab are the same as those displayed on the Value stream tab. You do not have to do any additional configuration to enable swim lanes. Because particles are organized by user, you can quickly determine if a particular user is overloaded, for example.
The users and particles that appear in a swim lane are determined by the DQL queries attached to the value stream. The queries defined in the value stream's JSON file determine the default content, which you can filter further by defining queries in the Query bar.
If a cell has 12 or more particles, particles are summarized by priority. In the accompanying figure, User 5 has 17 particles in the PROD stage; 4 with Medium priority, 1 with High priority, and 12 with Highest priority.
As with the Value stream tab, you can access particle data by hovering the mouse over the particle or selecting it. Particles provide access to particle history and links to the associated tools.
The functionally available on the Value stream view is available here as well; you can access the Metrics bar and Query bar.
To display a swim lane, complete the following steps:
-
On the HCL™ Accelerate Home page, click Value Streams, and then select a value stream.
-
On the value stream page, click Swim Lanes.
The swim lane is displayed.
Parent topic: Using value streams