Navigating value streams#
Manage a value stream's displayed data by applying filters and queries.
Value stream visualization provides an overview of the value stream workflow and summary information about the individual items contained in it. The items, sometimes called dots, represent objects from the tools that you use, such as builds, pull requests, issues, and tests. You use the To see objects from your integrated tools, apply filters by using the DevOps query language.
You can view value stream data in a user-focused way by using the swim lanes feature.
The highest level of a value stream is a phase. Phases contain the stages that define process flow within the phase. Stages contain data from integrated tools. Each data point is represented by an individual, graphical element. A item's position in the value stream conveys important information about the object. items in a stage named Merged, for example, can represent items merged into Git repositories. An item's shape and color convey information about the item's type and status. A item outlined in red, for example, might mean the item is past schedule. The border around a stage indicates how quickly stage items updated. When you hover the mouse over a item, the displayed card contains summary information about the item and links to associated tools.
In outline, to use a value stream, complete the following steps:
- On the HCL™ Accelerate dashboard, click Value Streams.
- On the Value streams page, select a value stream. By default, each value stream is displayed on a separate card. You can display a list of value streams instead. The value stream is displayed on the Value streams/value-stream-name page.
- Optionally, click
to display lead- and cycle-times.
- Filter the view. The items that appear on the value stream are determined by the tools that are integrated into the value stream, and queries that filter data from the integrations. Filtering options and search scope are described later in this topic.
- Optionally, click
and select Replace value stream map to modify the value stream and add queries defined in the
value-stream-name.jsonfile.
Understanding value stream data#
Queries that set the value stream scope are defined in the value-stream-name.json file. When you display a value stream, items matching the preset queries are displayed. The following graphic displays a value stream with items integrated from an issue tracking system and a source control system. Each stage has a query defined for it that determines the items that are displayed in it. The In Progress stage has a query defined for it similar to this one: "query": "issue.status=\"In Progress\" and pr.status!=MERGED and pr.status!=closed".
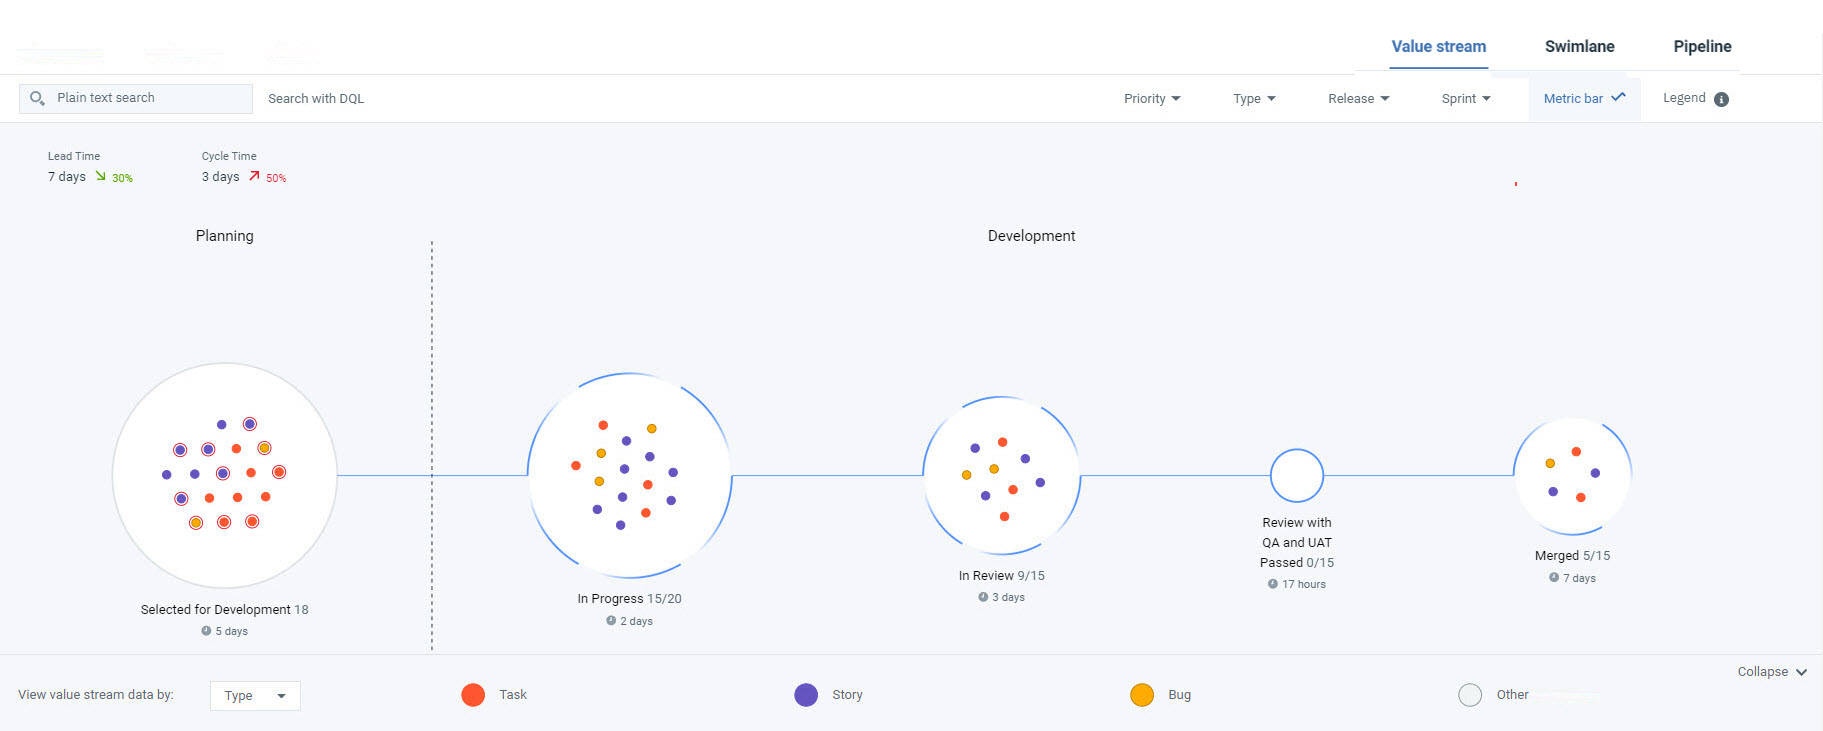
In the above figure, the display can filtered by the following: Type, Priority, Release, and Sprint.
Note: Click Legend to view data on Value stream page for each filter selection.
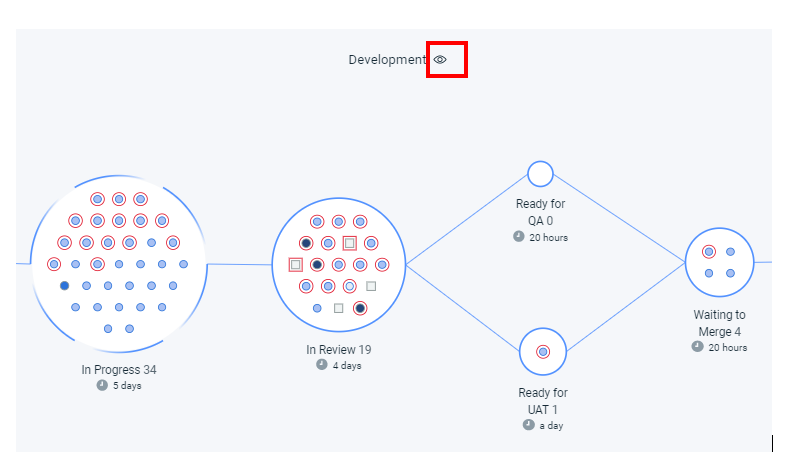
If a stage has more than 40 items, summary information replaces the individual items, as shown in the following graphic:

Use eye icon () to expand or collapse the phases in the value stream.
You can define stage queries in value-stream-name.json file to monitor one or more branches of git repository in the value stream.
Value stream multi-branching#
Value stream multi-branching allows you to create multiple branches of the stages in the product development lifecycle. You can create multiple branches from the stages using the targets property in vsm.json file. You can also create multi-branching between the phases of the product development lifecycle. The below code is example of creating multiple branches from the Backlog to Selected For Development and In Progress.
{
          "name": "Backlog",
          "query": "",
         "targets":["Selected For Development","In Progress"],
          "description": "",
          "wipLimit": null,
          "gates": null
        },
        {
          "name": "Sprint",
          "query": "",
          "targets":[]
          "description": "",
          "wipLimit": null,
          "gates": null
        },
  {
          "name": "Review",
          "query": "",
          "targets":[]
          "description": "",
          "wipLimit": null,
          "gates": null
        }
Note: There is no value for targets property in VSM.json file, the stage connects to the next available stage. In the above code example, Sprint stage connects to Review stage.
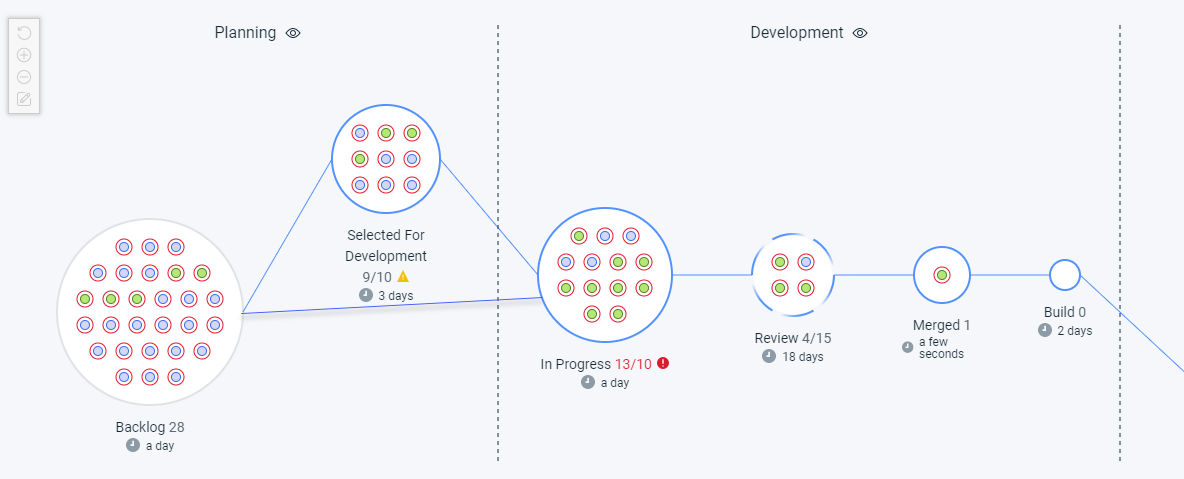
You can use edit mode button  to do drag and drop the stages inside the phases of the development lifecycle. Click
  to enable/disable the edit mode. When you enable
  button, eye icons (
 and

 button. You can use zoom in
  and zoom out
  button for the detailed view of dots clearly. You can use reset
 button to default view of value stream. You can use button to zoom in, zoom out, and reset controls with the capability of switching to a non-edit view mode in value stream.
Note: The user requires create pipelines permission to do drag and drop for the stages using edit mode button.
Note: You can customize the value stream layout using the value stream multi-branching. The customized layout of value stream is applicable for all users of the value stream.
Value stream items#
You can display information about the items in a stage. When you click an item, a card is displayed with information about the represented item, such as a Jira issue. Full history about the item is presented in context, including its history. You can use the supplied links to open the item in originating tool.
The following graphic displays a Jira issue in the value stream's In Progress stage. Links, highlighted in red in the graphic, can open the item in the integrated tool.
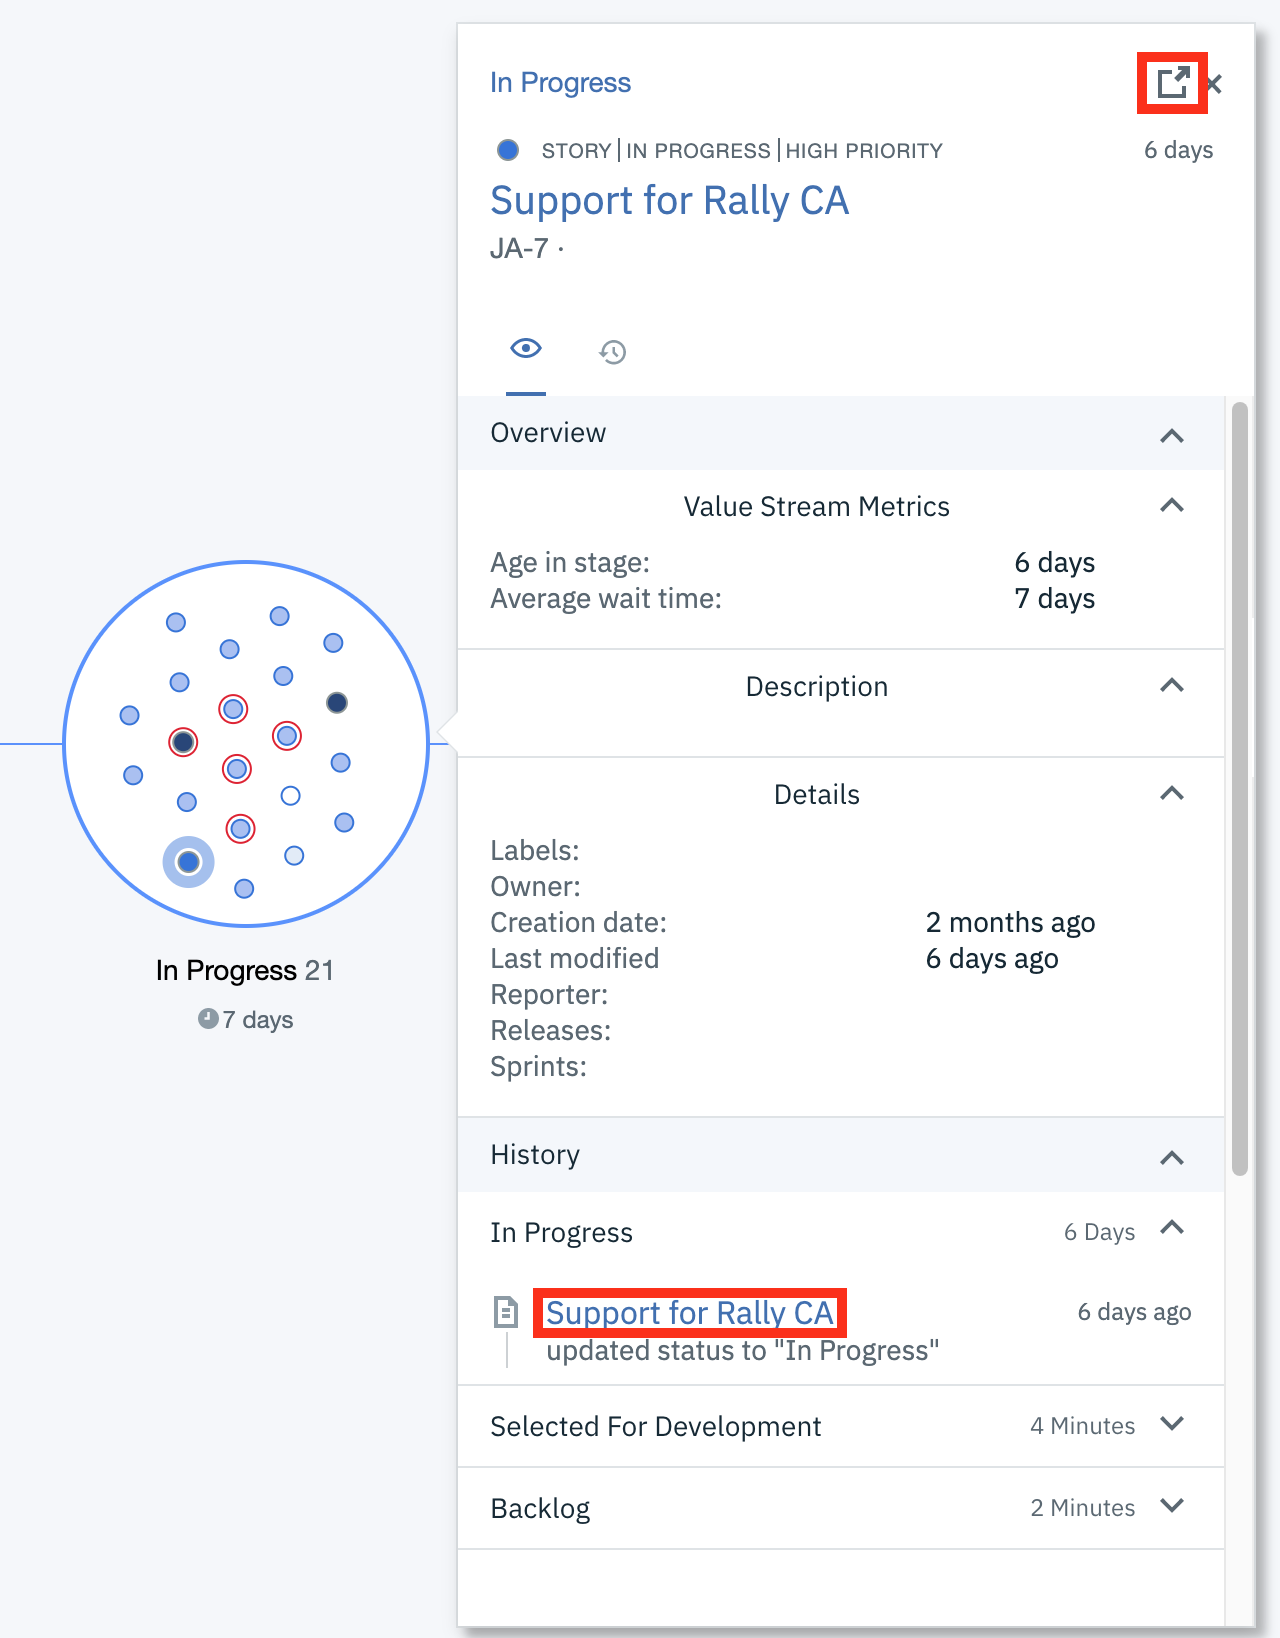
If linking rules are defined for the integrations, information from the linked tools and available. Link rules link two integrated tools, such as Git and Jira, to make information from both tools available in the affected items.
Value stream view by#
At the bottom of the Value stream or Swim Lanes pages next to the View value stream data by list, you can view your data by selecting one of four criteria applied to the value stream data with an associated color legend and may also be shape coded by the information detailed in the following table and figure:
| View value stream data by | Description |
|---|---|
| Priority | Level of importance such as low, medium, high, and so forth. |
| Release | The release versions. |
| Sprint | Sprint numbers, names, or both. |
| Type | Issue type such as story, bug, task, epic, and so forth. |
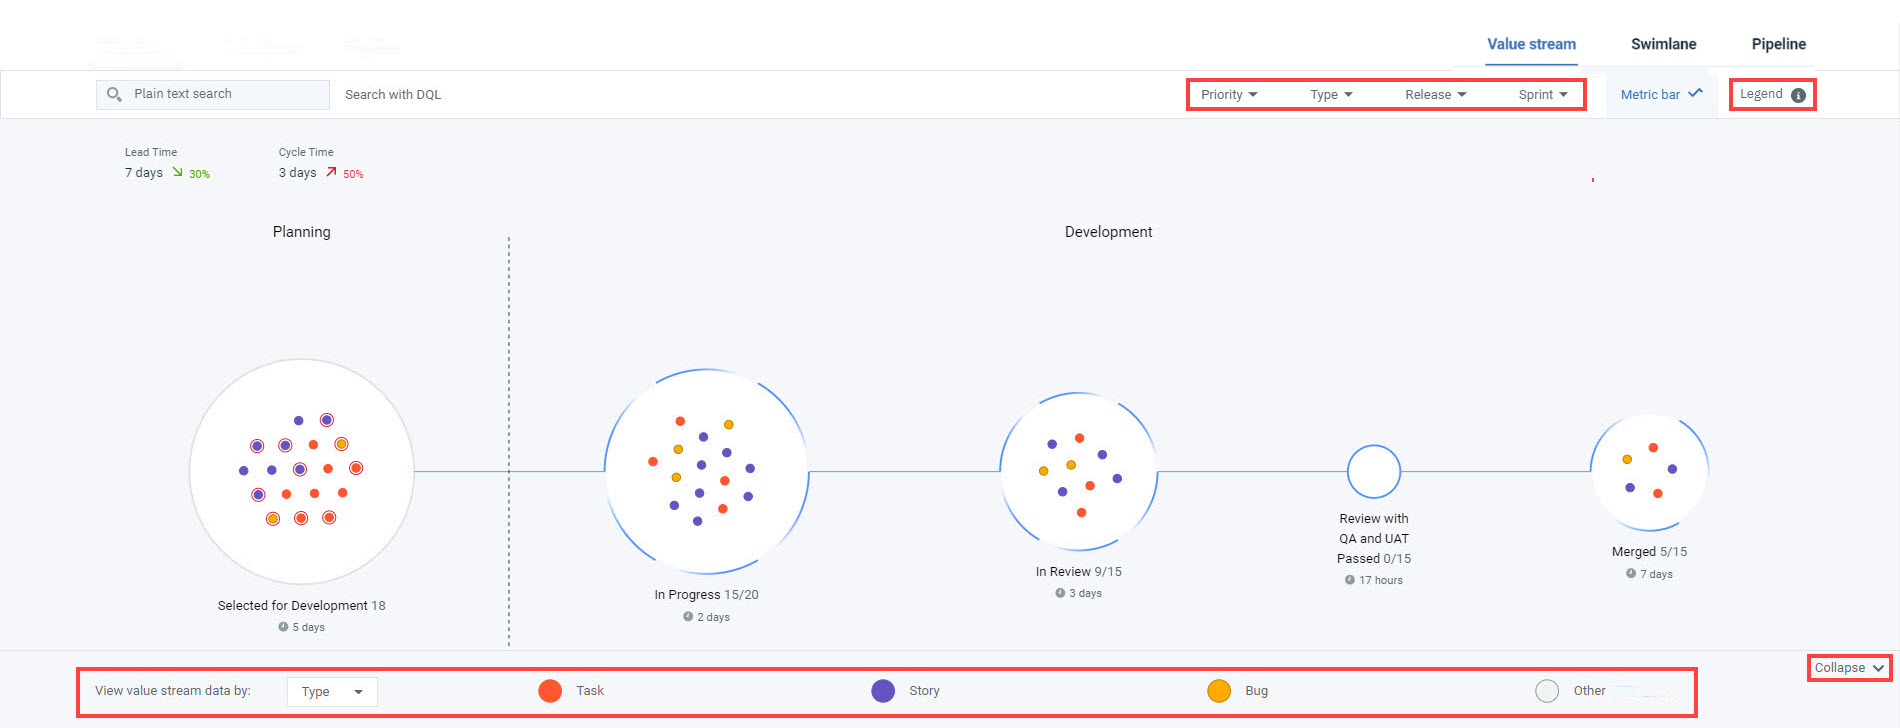
Note: If the View value stream data by bar is not visible on either the Value stream or Swim Lanes pages, click Expand located toward the bottom right corner of the respective pages to display the bar. Additionally, if the bar is visible and you want to hide it, click Collapse.
Toward the top right corner of either the Value stream or Swim Lanes pages, click Legend to display additional identification details for the items including any of the aforementioned shape coded items. To view value stream data by a range of data, click the View value stream data by list and select your required criteria
Quick filters for value stream data#
At the top of the Value stream or Swim Lanes pages to the left of the Metric bar button shown above, you can use quick filters to limit the amount of value stream data that is displayed based on the selected criteria of priority, release, sprint, or type that is detailed in the above table.
Ensure the View value stream data by bar is visible on the bottom of either the Value stream or Swim Lanes pages and perform the following procedure to search and limit the display of value stream data based on your required criteria.
- Click the View value stream data by list and select your required criteria. The color coded items associated with the selected criteria are displayed in the legend on the bottom bar.
-
To further limit the display of value stream data, you can apply quick filters by clicking on Priority, Release, Sprint, and Type and selecting check boxes within each item in any multiple combinations of all filters to the previously selected criteria in the bottom bar for precise narrowing of your required data range. To display the value stream data of all current sprints, select Current Sprint(s) check box from the Sprint quick filter list.
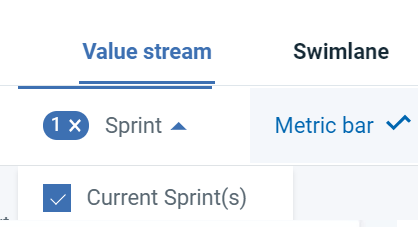
An example of the Priority quick filter applied with the High and Highest criteria selected is illustrated below.

-
To remove the quick filters, either click the x to the left of any filters that were selected as shown above or individually deselect individual items within each of the criteria.
Dot alerts#
You can see alert for the dots in value stream for the following scenarios,
- Dots that are unassigned.
-
Dots with long wait time.
Note: Wait time is defined as the time between the current time and the last status update of the dot. This alert is generated when a dot's wait time is greater than the average wait time across all dots. Dots alert specifies the value of waiting time.
-
Dots with build status failed.
Note: Dots alert specifies reference of the failed build.
-
Dots with deployment status failed.
The figure below is an example of dot alerts for long wait time and build failed.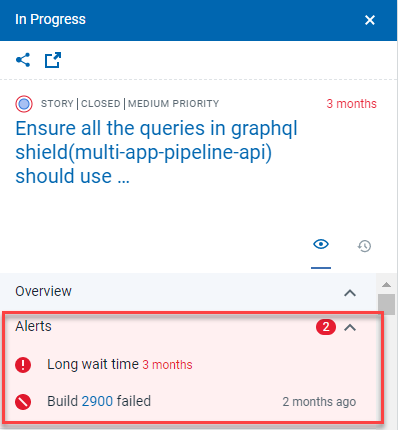
Stage circle speed#
Stage circle speed is the average time of all the dots per workflow. There are four types of stage circle speed.
- Blue circle with three segments - Stages with slow circle speed. The dots in the stages are progressing slowly compare to other stages of the workflow.
- Blue circle with six segments - Stages with medium circle speed. The dots in the stages are progressing in medium speed when comparing with fast and slow stages.
- Blue circle - Stages with fast circle speed. The dots in the stages are progressing fast compared to other stages in the workflow.
- Grey Circle - Stages with insufficient data.
The stage time is displayed below each stage circle.
Searching the value stream#
Searching a dot in value stream data is possible in two ways, Plain text search and Search with DQL
Plain text search is the free text search of the dot in the value stream. When search text is entered in Plain text search field, it displays all dots which are associated or contains the search text. Use Plain text search field to search the dots with issue id, issue labels, issue name, issue owner, issue priority, issue types, releases, and sprints.
Use Search with DQL field to search the dots with DQL queries and DQL operators.
Note: In case, no dots is available for the search data, value stream will display a error message. 
- Managing swim lanes
Use swim lanes to display a user-centered view of your value stream data.
Parent topic: Value stream management
