State of sprint report#
The State of Sprint Report page displays all the sprints with related work items for a value stream selected as the output for the report execution.
The State of Sprint Report page provides comprehensive details of all active and inactive sprints for a selected value stream. All of the issues are aggregated by each sprint and grouped according to the stage position of the items in the value stream. Present sprints are identified as Active while past and future sprints are indicated as Inactive on the State of Sprint Report page. For a given sprint in a value stream, data represented in the report includes the following:
- Start, end, and completed dates
- Total issues number
- Percentage issues done
- Story points planned number
- Story points done number
- Issues not pointed number
- Contributors number
Additionally, Pointed vs Not Pointed and Planned vs Done (Release) bar chart graphs for all the sprints in the value stream are displayed at the top of the State of Sprint Report page.
Note: The Handlebars Reporter plug-in must be installed in order to run and view the State of Sprint Report.
To run the State of Sprint report, perform the following procedure:
- Click Insights > Reports.
-
Select the State of Sprint field under the Report Templates heading on the left side of the page.
Note: When the State of Sprint field is selected, a vertical blue bar is displayed on the left side of the field to indicate it as the report to run.
-
Click Run Report to display the RUN REPORT window.
-
Select the required Value Stream from the list.
Note: To set a value stream as default, click Set as Default.
-
Click Confirm to run the report.
-
Fields on the State of Sprint Report page are detailed in the following table:
Field Description DATE Date, time, and email address of user who ran the report. STATUS Color-code status: Orange = STARTED, green = COMPLETE, and red = FAILED. View log Click View log to display log details for the report. View parameters Click View parameters to display the VIEW PARAMETERS OF EXECUTION window that indicates the Value Stream used for running the report. Share Click Share to copy the URL link for sharing the report. Results Click Results to display the State of Sprint Report page.
A sample State of Sprint Report page is shown below.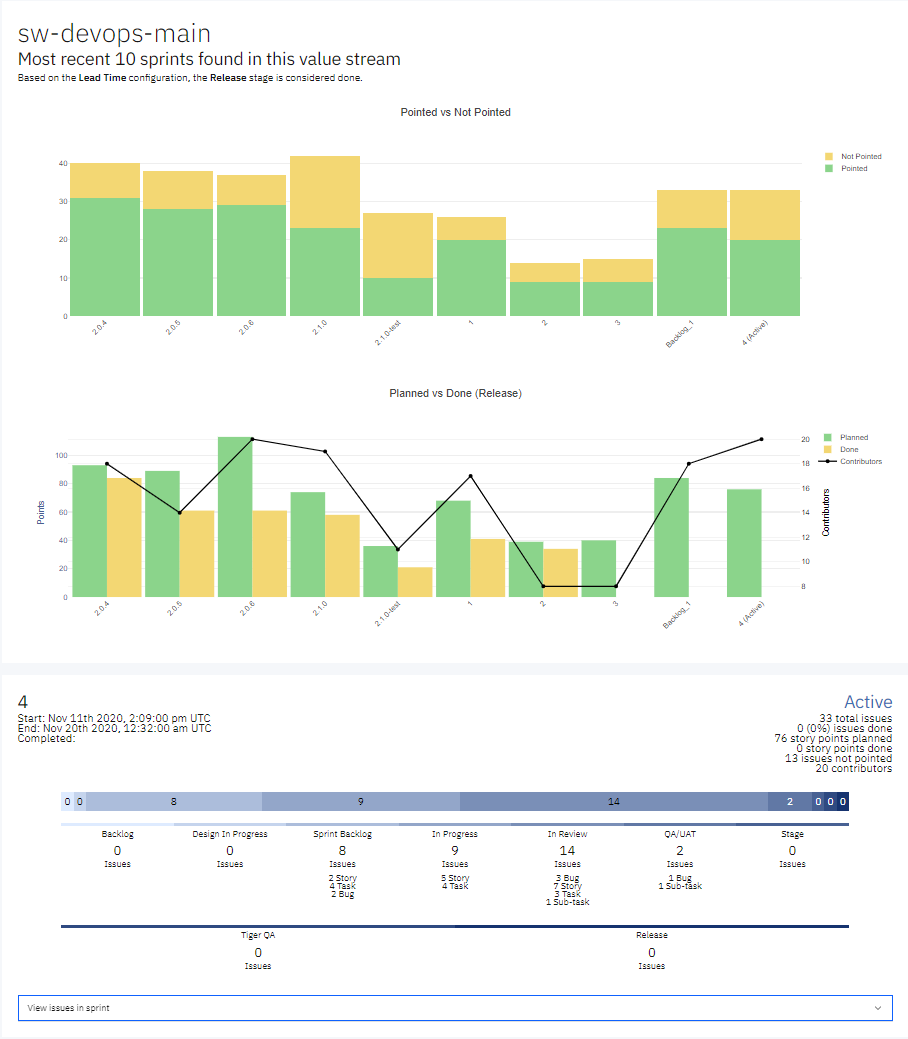
The Pointed vs Not Pointed and Planned vs Done bar charts are both interactive and you can hover over any areas of the chart to dynamically display values and plot tool icons providing extended functionality. You can click on different areas of the blue shaded bar chart above to display the stage name with number of related issues.
Click the View issues in sprint bar to extend and display the related issues for each stage of the value stream as shown below.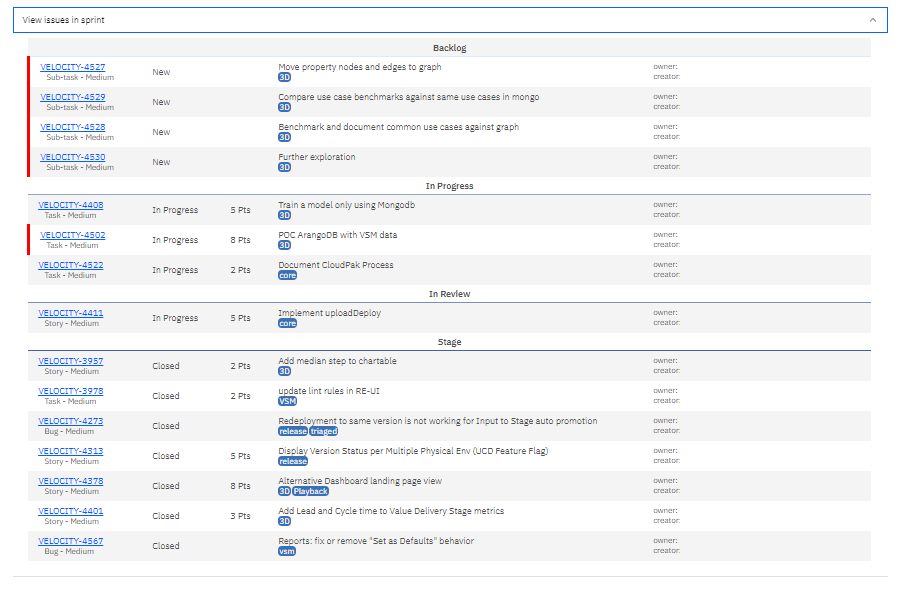
The red vertical bar indicates alerts for issues such as over median time, no owner, and so on. You can click the issue link to open the ticket in a browser window to view detailed information for that item.
Parent topic: Insights reports